
From control units to mathematical models: this is how air quality is measured in Italy and why sometimes pollution is not where we expect it.
How is the air quality in Italy, and who measures it? But above all, how can you establish that in a certain area, on a certain day, the air is good? To answer these questions we went behind the scenes of environmental monitoring together with ARPA Lazioto find out how and with what tools this data is collected and what it tells us about the air we breathe.
The main pollutants measured: PM10, PM2.5, NO2 and ozone
According to the law, a pollutant is any substance present in the air that can produce harmful effects on human health or the environment.
The maps of air quality keep below check24 hours a day, i four main pollutants: PM10 and PM2.5 fine particles, nitrogen dioxide and ozone. Different substances, but with common origins: in fact, they almost all derive from domestic heating, vehicles and industrial and agricultural emissions. Alongside these continuous checks, other substances are analyzed on the filters in the laboratory or over longer periods: work that allows us to trace the source of the pollution even more precisely.
The map of air quality in Italy: what the data says
To really understand what the air we breathe is like, we need to look pollutant by pollutant.
According to the latest report from National System for Environmental Protectiontoday the air quality respects the legal limits in most of the Italian territory, and fine particles have been decreasing for decades.
From the 2030However, the thresholds will become more stringent, to get closer to the WHO guidelines.
According to estimates by theEuropean Environment Agencyin fact, in 2023 exposure to fine particles above the levels recommended by the WHO was associated in Italy with more than 43 thousand premature deaths: the highest figure in the entire European Union.
The case of the Sacco valley: when pollution is not where we expect it
It would be natural to think that the most polluted areas are always there big citieswith their traffic and their homes, yet this is not always the case.
In the Laziofor example, one of the most historically critical territories is not Rome, but the Sacco valleybetween the provinces of Frosinone and Rome. This happens because in this area two factors add up: on the one hand the conformation of the territorya basin surrounded by mountains in which air circulates with difficulty and pollutants tend to stagnate; on the other, human activities, such as wide use of wood and pellet heating in winterwhich can release a lot of fine dust.
From the control units to the mathematical model
In Italy monitoring is entrusted to HARPthe Regional Environmental Protection Agencies.
Taking Lazio as an example, let’s get into the functioning of fixed control units (53 throughout the region, of which 14 in Rome alone) and gods mobile laboratories set up on vans. Once collected, the data follows two paths: the automatic analyzers they measure the main pollutants – the values of which are validated day by day – while the particulate matter is collected on special filters and taken to the laboratory to study its chemical composition.
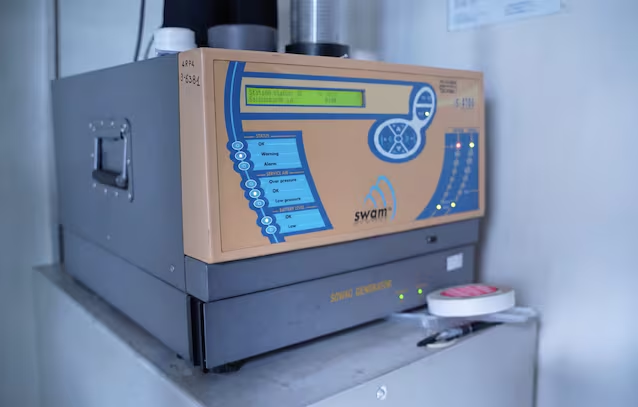
Then we follow the path of the data to the heart of the analysis, i.e. a mathematical model which combines measurements, emissions, weather and territory characteristics to estimate air quality on a 1 km × 1 km grid (even where there are no control units), and to predict it in the following five days.
All this data, among other things, is public, and anyone can consult it on the websites of the individual regional ARPAs.
What to do and how to intervene
The data is used to photograph reality, but above all to understand how to interveneand we too can do our part: although it often happens that everyone thinks that their individual choices are just a drop in the ocean, the numbers demonstrate that air quality also depends on our daily behaviors.
For short trips, for example, when we cannot move on foot or by bike, i public transport they are much better than a car with only one person in it. For home heating, however, if they are used stoves or fireplaces What matters above all is the way in which it is done: the choice of wood (preferring dry wood) and the maintenance of the chimney are not details to be underestimated. And so do I radiators they have their weight, because every degree more means more fuel burned and therefore more emissions.
They seem like just small measures but, done by many people and added together, they can really make a difference.