Thanks to Dangerous maps ofIspra (Higher Institute for Environmental Protection and Research) through Hydrogena multilingual and updated platform in real time it is possible to view, interrogate, download and share maps and data on hydrogeological instability in Italy. There are several regions of our country subject to this risk including Emilia-Romagna, Tuscany, Sardinia, Campania, Veneto, Calabria, Lombardy and Liguria.
How to consult the maps of the danger and the risk of floods
In the section “Dangerousness and risk”, You can view the I levels of danger for landslides and floods. The user can search for an address, geolocalize, question the data, Create a report And Check the danger In a point of interest by displaying the perimeter of the geographical areas that could be affected by the flooding of a watercourse according to the following scenarios:
- Poor probability of floods or scenarios of extreme events P1, return time between 300 and 500 years (scenarios of incorrect extreme events);
- Average probability of P2 floods, return time between 100 and 200 years (not very frequent floods);
- high probability of P3 floods, return time between 20 and 50 years (frequent floods);
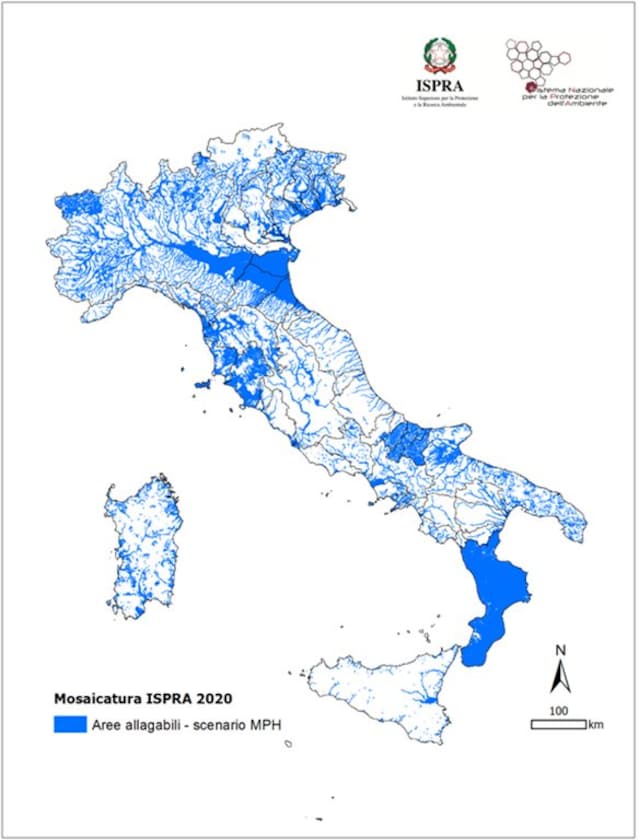
The high hydraulic danger areas in Italy are 16,224 sq km (5.4% of the national territory), the average dangerous areas amount to 30,194 sq km (10%), those with low danger (maximum expected scenario) at 42,376 km2 (14%) (Mosication v. 5.0 – 2020)
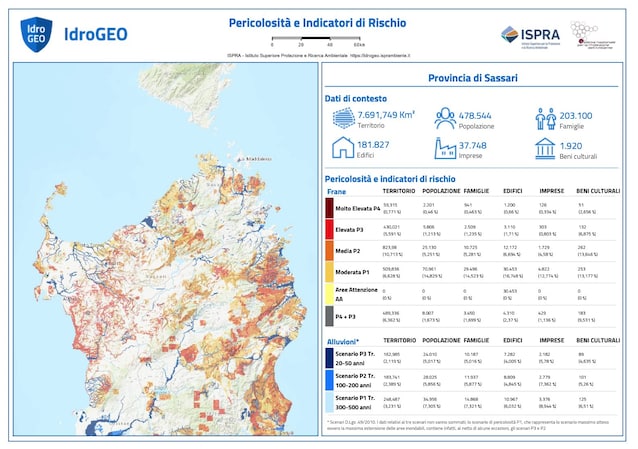
The P1 dangerous scenario represents the Maximum expected scenario That is, the maximum extension of the floodable areas and the risk maps indicate the potential negative consequences deriving from floods for each of the three dangerous scenarios. For each scenario it is therefore possible to extract the data relating to Resident population, families, buildings, businesses and cultural heritage at risk aggregates on a national, regional, provincial or municipal basis.
Furthermore, if you want to deepen, the dangerous maps of ISPRA represent the development, homogenization and enhancement of less recent systems, which have been made by the district basin authorities (at regional level), the so -called Hydrogeological structure plans (PAI). Therefore in addition to the dangerous maps you can always refer to the various regional services that are more localized and detailed.