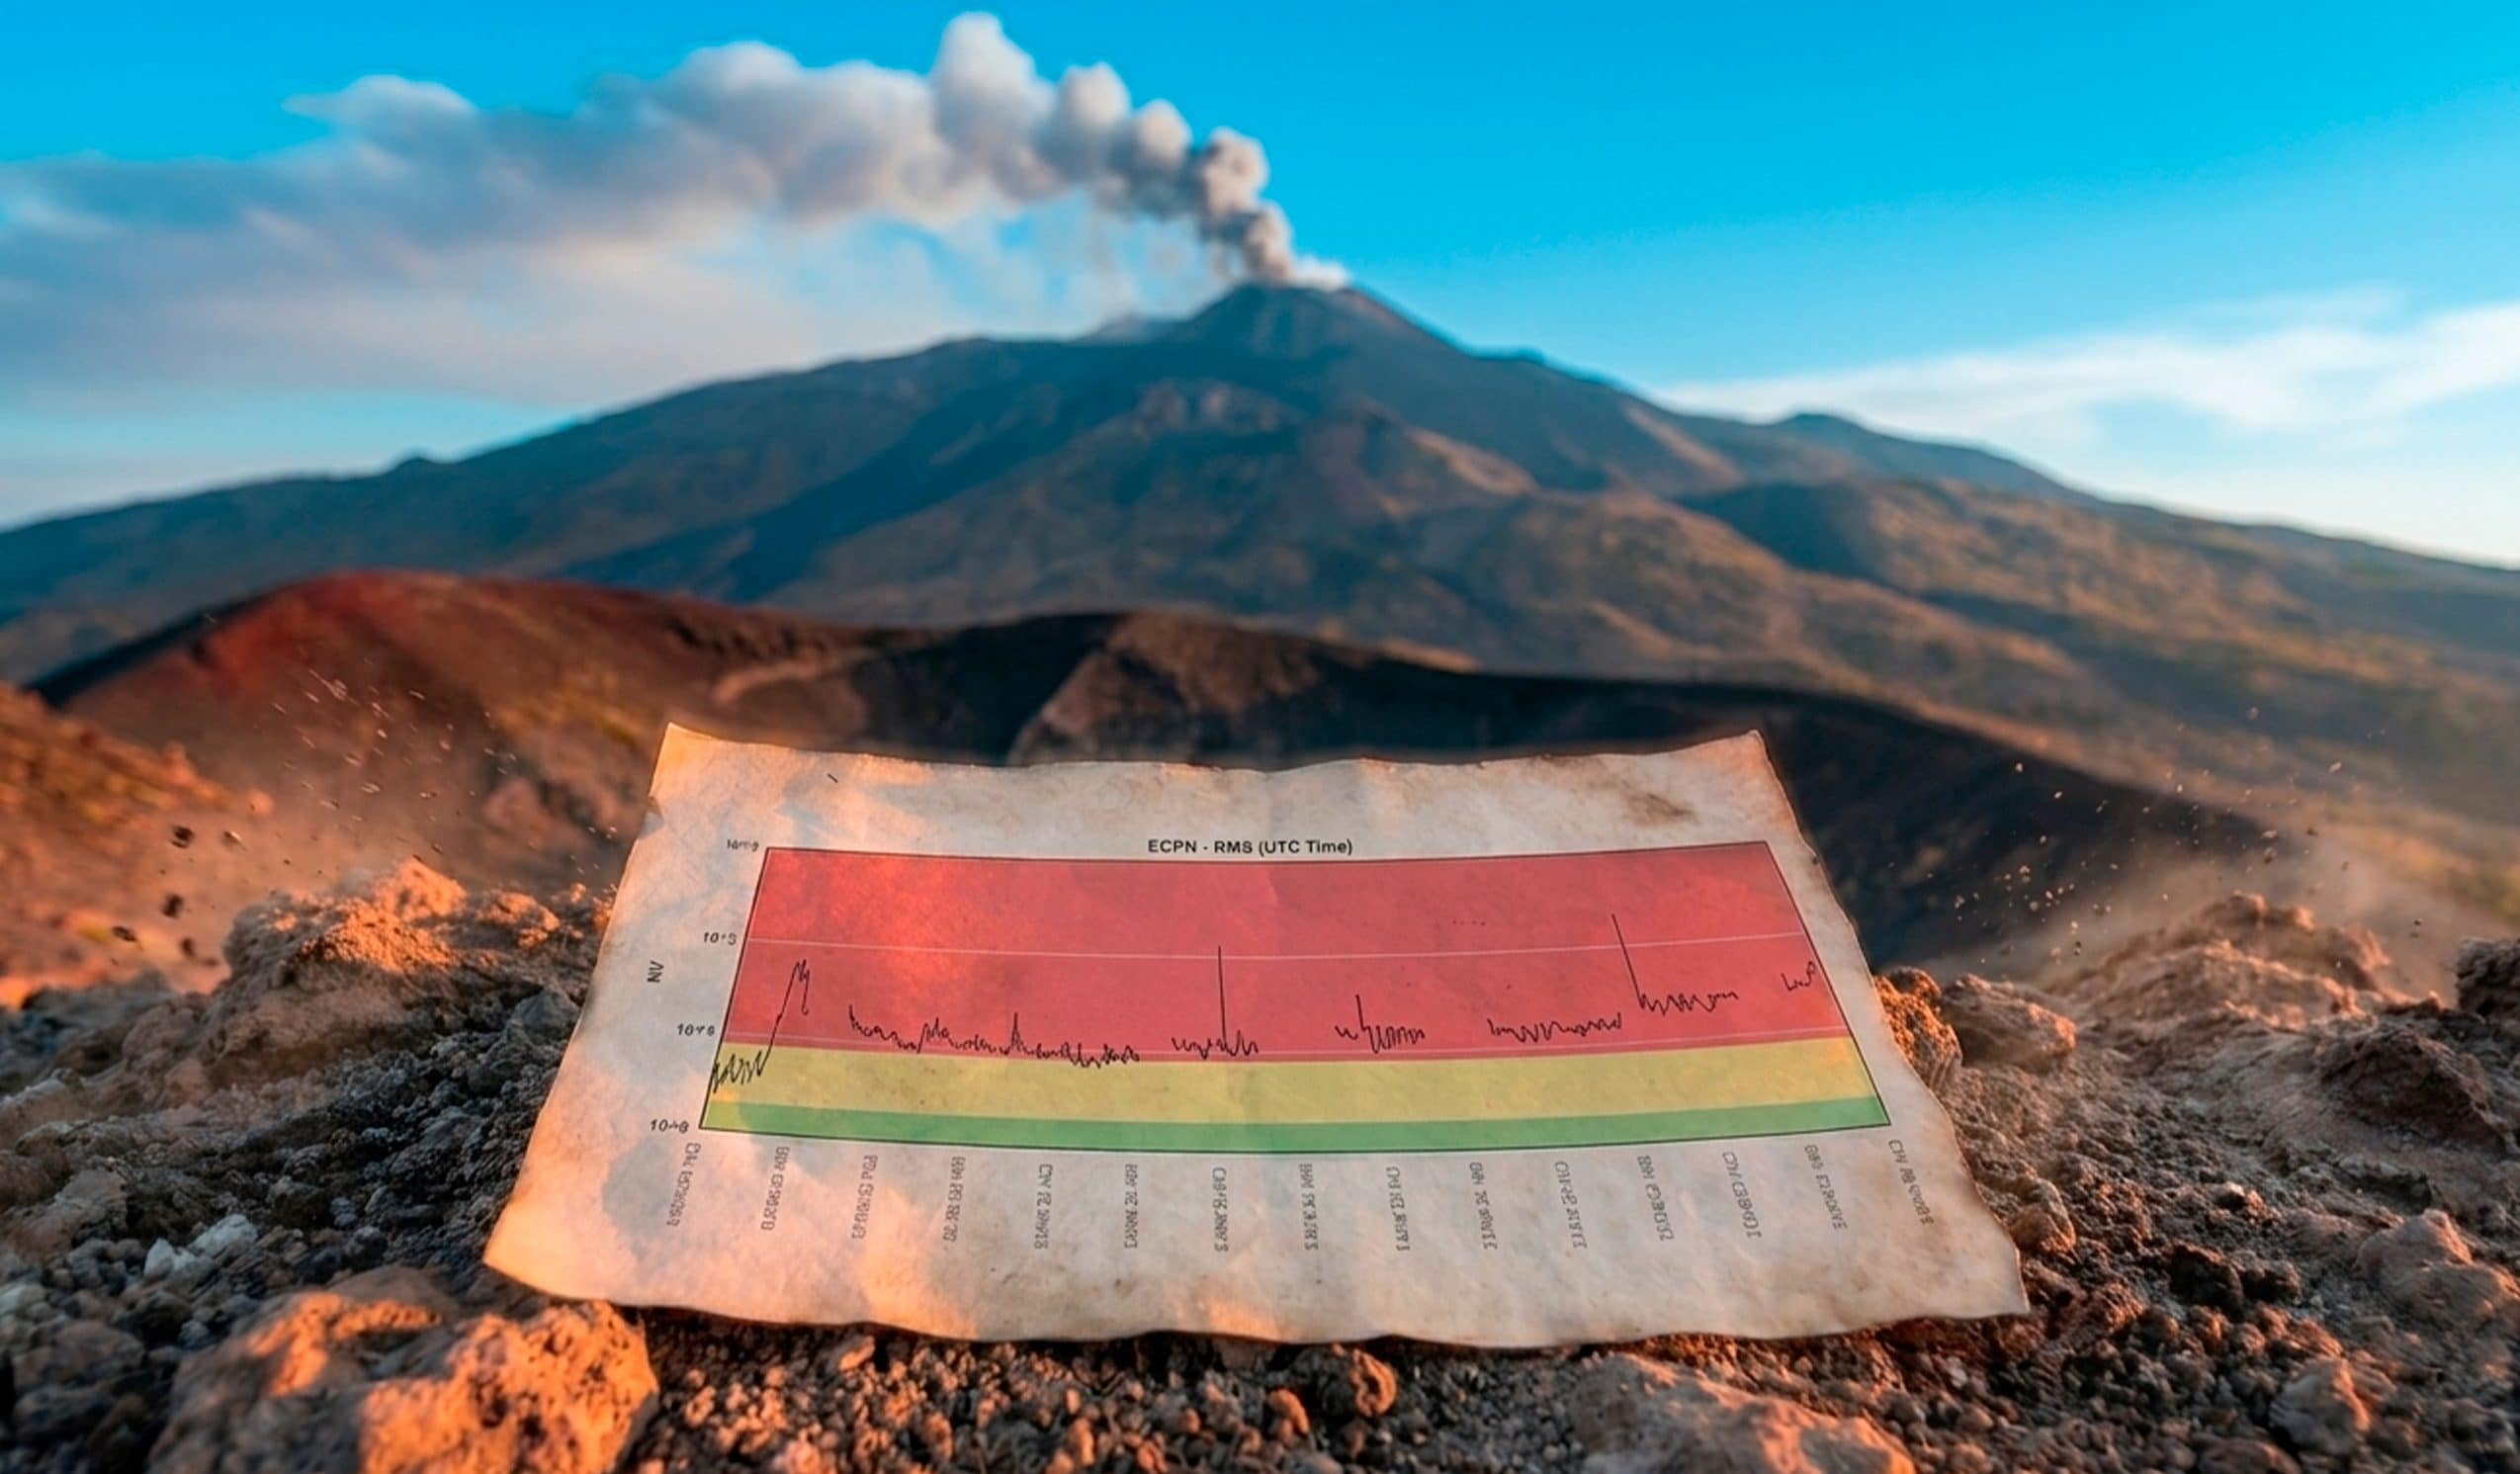
With the resumption of Etna’s eruptive activity, we hear more and more often about the “breath” of the volcano, technically known as volcanic tremor. But what is it exactly? Unlike a normal earthquake, which manifests itself with a sudden shock, the tremor is a continuous seismic vibrationa background hum caused by the rise of magma, gas and fluids inside volcanic conduits. To monitor it, INGV uses a dense network of seismographstranslating the data into graphs accessible to all, which constantly record it.
Etna’s recent activity has forced theCatania airport to block all arriving and departing flights until 02:00 on August 14th. A blockade that aggravates the inconveniences of the last week, marked by hundreds of cancellations and planes diverted to the airports of Palermo and Comiso.
The volcanic tremor on Etna: how it is measured
The tremor volcanic it is a seismic vibration originating from the movement of magma, hydrothermal fluids and gases that rise inside the volcanic conduits. Wanting to give a more common example, let’s think of the heating pipes in our homes when the water starts to circulate: sometimes you can hear a continuous, almost annoying gurgling sound. Here, essentially the same thing happens on Etna, but on a much larger scale. A earthquake “normal” in fact, it is an event with a sharp beginning and a clear end. The tremor, on the other hand, is a almost continuous background humwhich can last hours, days, and in some cases even years.
To listen to this very subtle vibration, INGV has placed a very dense network of seismographs very sensitive all around the volcano. The signal they collect is transformed into a number: the RMS (Root Mean Square) amplitude, measured in millivolts (or in nanometers per second if converted to actual ground speed). The calculation focuses on a very specific frequency band typically between 0.5 and 2.5 Hzwhich is like the “digital signature” of the movement of volcanic fluids.
However, an earthquake can be located relatively easily by looking at when the waves arrive at various stations. The tremor, however, does not, since its waves emerge slowly from the background noise, without a clear start to time. For this reason, volcanologists must estimate the source by comparing the amplitude of the signal recorded by the different stations in the network.
How to read the INGV graph and why it is not possible to understand which vent will erupt
If you have ever gone to the INGV website, you have probably seen that graph with the jagged lines, like the one below.
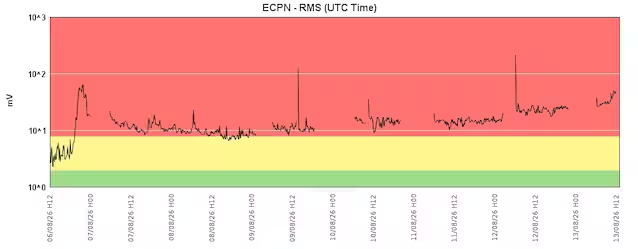
The horizontal axis indicates the timein hours and days, while the vertical axissignal intensity – that is, how strong the seismic tremor is. Then there are three colored bands, which help us understand the state of the volcano even at a glance. In this case the tremor has been in the lower portion of the red band since the afternoon of August 6th – corresponding to the beginning of the ongoing eruptive phenomenon – and seems to be increasing in the last few hours.
But be careful: when we look at these graphs, we must keep some things in mind so as not to be misled. First of all the presence of a peak it does not necessarily equate to an eruption, given that an oscillation in tremor values is normal within the life of the volcano, even in moments of rest. Plus these peaks they can’t tell us where the lava will come from: it is impossible to establish the crater or eruptive vent in advance. For these reasons, when you hear about tremor it is good to remember that it is not a crystal ball but a useful tool to be added to all the others supplied by the INGV.