On the morning of January 28, 1986 Space Shuttle Challenger it disintegrated 73 seconds after liftoff from Kennedy Space Center in Cape Canaveral, Florida. All seven crew members died. The disaster was caused by a design error of the rockets used in the first launch phase and the unusual cold, which did not allow the rubber seals to expand correctly to seal a leak. The evening before the launch, some NASA engineers had reported the risk. The data availablehowever, they were incomplete and the management decided not to postpone the flight anyway.
Precisely to prevent disasters like this from happening again, Jack Brittain and Sim Sitkin, professors of business and management, created a famous case study: The Carter Racing. This case study, used for decades in business schools, aims to show how dangerous it can be to make decisions without having all the information and without asking “What is missing from the data I am observing?”.
In this article we delve into the “Carter Racing” case and what can happen when we do not consider all the available data.
The “Carter Racing” thought experiment: should we risk it or retreat?
Let’s imagine we own Carter Racing, one stable Formula 1 car. In an hour the most important race of the season will begin, broadcast live nationally.
Our cars are very powerful: we placed ourselves among the top 5 in 12 of the last 24 races and we are confident of arriving on the podium today too. If we succeeded, we would get a rich prize money and a million-dollar sponsorship contract. There is, however, a problem: in 7 of the last 24 racesThe motor of our cars yes it is burned. If it happened again, in front of the cameras, we could lose everything: sponsors, prizes, credibility. Not to mention the risk to the lives of the pilots. But withdrawing also has consequences: we would lose the registration fee, we would have to reimburse the sponsors and we would end the season at a loss.
Our mechanics have understood that the cause of the damage is the seal failure of the engine head, but they cannot identify precisely why it happens. Some suspect temperatures are too low, others hypothesize a design or manufacturing flaw, but no one has enough data to be 100% certain.
The race is due to take place in an hour and the weather today is particularly cold: 4°C, well below any temperature the car has experienced so far. To help us decide, a graph is hastily prepared which puts in relate the external temperature at the time of the race to the number of failures. Looking at it, the damage seems randomly distributed: there were problems at both 11°C and 24°C.
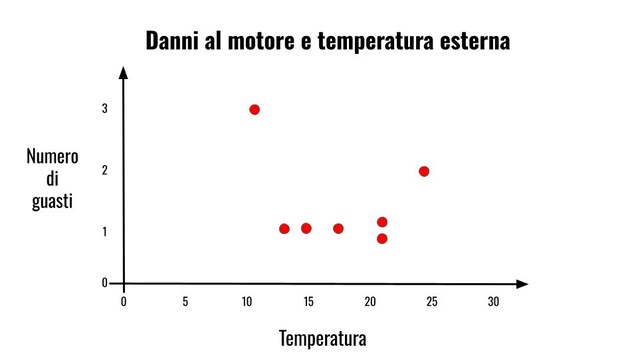
So, what do we do: let’s run and we risk damage to the engine or we retreat and we lose all sponsorships?
If we look at all the data our choices change
If we have chosen to run, we are not alone. This thought experiment has been presented to business and management students for decades. After long discussions, most decide that there is no relationship obvious between temperature and damage to the engine, and concludes that it is worth the risk.
The problem, however, is that no one asks:
Where are the data of the races in which the engine Not did you have any problems?
The graph shown, in fact, only shows the runs in which faults occurred. But if we also include the 17 races in which everything went well, the scenario changes completely: all the engines that ran without problems did so at temperatures above 18°C. Below that threshold, a failure always occurred.
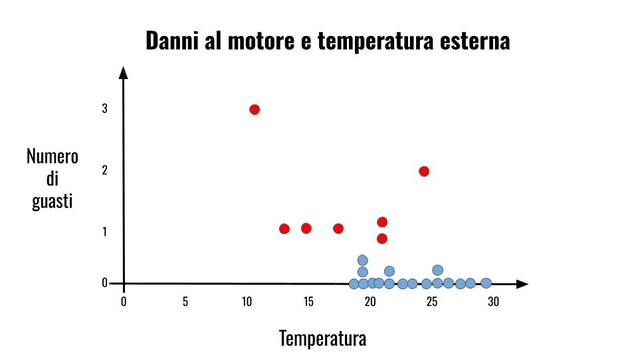
With this new information, the best decision is clearly retreat. Racing today, at 4°C, almost certainly means engine damage.
The Space Shuttle Challenger disaster
This thought experiment is useful for assessing students’ risk propensity and for teaching them a key principle: before deciding, you need to observe all the data, even those that are missing. Ask yourself “what am I not seeing?” sometimes it can save lives. The data underlying Carter Racing, in fact, are based on data that could have avoided the disastrous explosion of the Space Shuttle Challenger, in January 1986.
As mathematician Hannah Fry and sociologist Diane Vaughan recount, the evening before the launch of the Challenger some engineers were summoned by NASA for an emergency telemeeting. The launch zone had been hit by adverse weather conditions for a week now with temperatures close to zero, never experienced before during a launch. The engineers were concerned about the booster sealsthe rockets used in the first phase of takeoff. These seals, called O-ringsthey had to seal the joints between the segments of the boosters, assembled and welded in the launch area. If a weld broke, they would have to expand to close all the gaps. But in the cold, the elastic properties of rubber are reduced. Engineers rightly feared that the O-rings wouldn’t work properly at those temperatures.
To try to convince management to postpone the launch, engineers prepared and faxed data from previous malfunctionssimilar to the Carter Racing graph. Once again, however, it only reported cases with problemsand not the ones where everything had worked correctly. Without that “missing” data, the relationship between cold and failures did not emerge clearlyand the launch was confirmed. On the morning of January 28, 1986, the Challenger took off and, after just 73 seconds, destroyed itself in flight, causing the death of all seven crew members.