THE’sea level rise it is one of the most worrying signs of global warming, and the real challenge is to understand how much it will increase in the coming decades. To try to answer this question, NASA developed the Sea Level Projection Toolan open-access interactive application that allows anyone to explore sea level rise projections between now and 2150. But how exactly does this tool work?
How NASA’s Sea Level Projection Tool works
NASA has created a tool capable of converting a huge amount of extremely complex physical calculations into a simple and intuitive interface. Users can navigate on an interactive map and click on any point of the ocean or coast to view the sea level trend for that location, over a time interval ranging from 2020 al 2150.
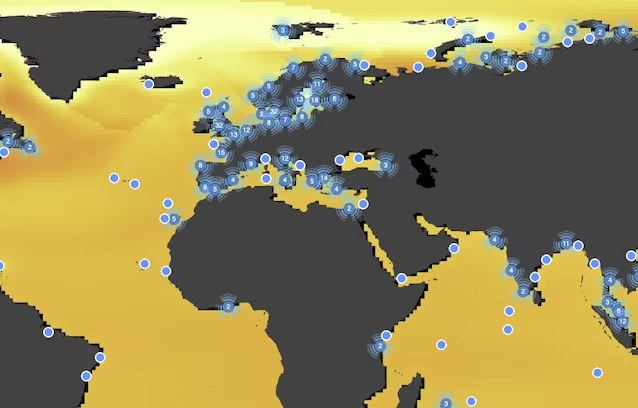
What’s interesting is that the model doesn’t just provide a final number with the forecast, but is able to break down the rise into individuals processes physicists. What do I mean? By clicking on a specific area, the tool tells us what the drivers of change are for that area, for example thethermal expansion of waterthe melting of glaciers or the ocean circulation.
Where the map data and worst-case scenarios come from
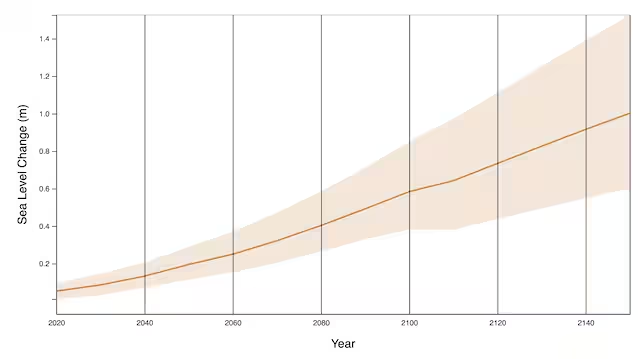
All estimates are based on data from Sixth Evaluation Report (AR6) of theIPCC – Meaning what Intergovernmental Panel on Climate Change, a United Nations body that deals with the study of the climate. In particular, the tool incorporates the scientific analyzes published by Working Group I on 9 August 2021. Sea level projections are calculated with respect to the base period 1995–2014 and vary according to different people socio-economic emission scenarios or global warming levels.
The most virtuous scenario is this SSP1-1.9in which CO emissions₂ they reach “net zero” by mid-century and global warming is contained to around 1.5°C. On the contrary, the worst case scenario isSSP5-8.5: this is the one characterized by high emissions and strong dependence on fossil fuels, without new climate policies. By cross-referencing uncertainty about future emissions with the physical response of ice and oceans, the model identifies the ranges of sea rise considered more likely. Taking some Italian cities as an example in 2150, the model predicts an increase of 1 meter For Civitavecchia And TriesteOf 1.05 meters For Palermo And Naples and even of 1.15 meters for Venice.
By simplifying access to this scientific consensus data, NASA’s tool represents a fundamental resource for coastal planners and policy makersallowing them to design adequate infrastructure and protect coastal communities from the environmental risks of the coming centuries.