Beneath our feet lies the largest biological infrastructure on the planet: a long, living, invisible network 110 quadrillion kilometersthat is to say almost a billion times the distance between the Earth and the Sun. It is formed by billions of microscopic filaments called hyphae (from Greek hyphe“fabric”), belonging to the so-called arbuscular mycorrhizal fungi (AM fungi). These microscopic organisms live in perfect symbiosis with the roots of 70% of terrestrial plants and they play an important role for the climate by trapping in the soil an amount of carbon equal to 11% of our annual global emissions.
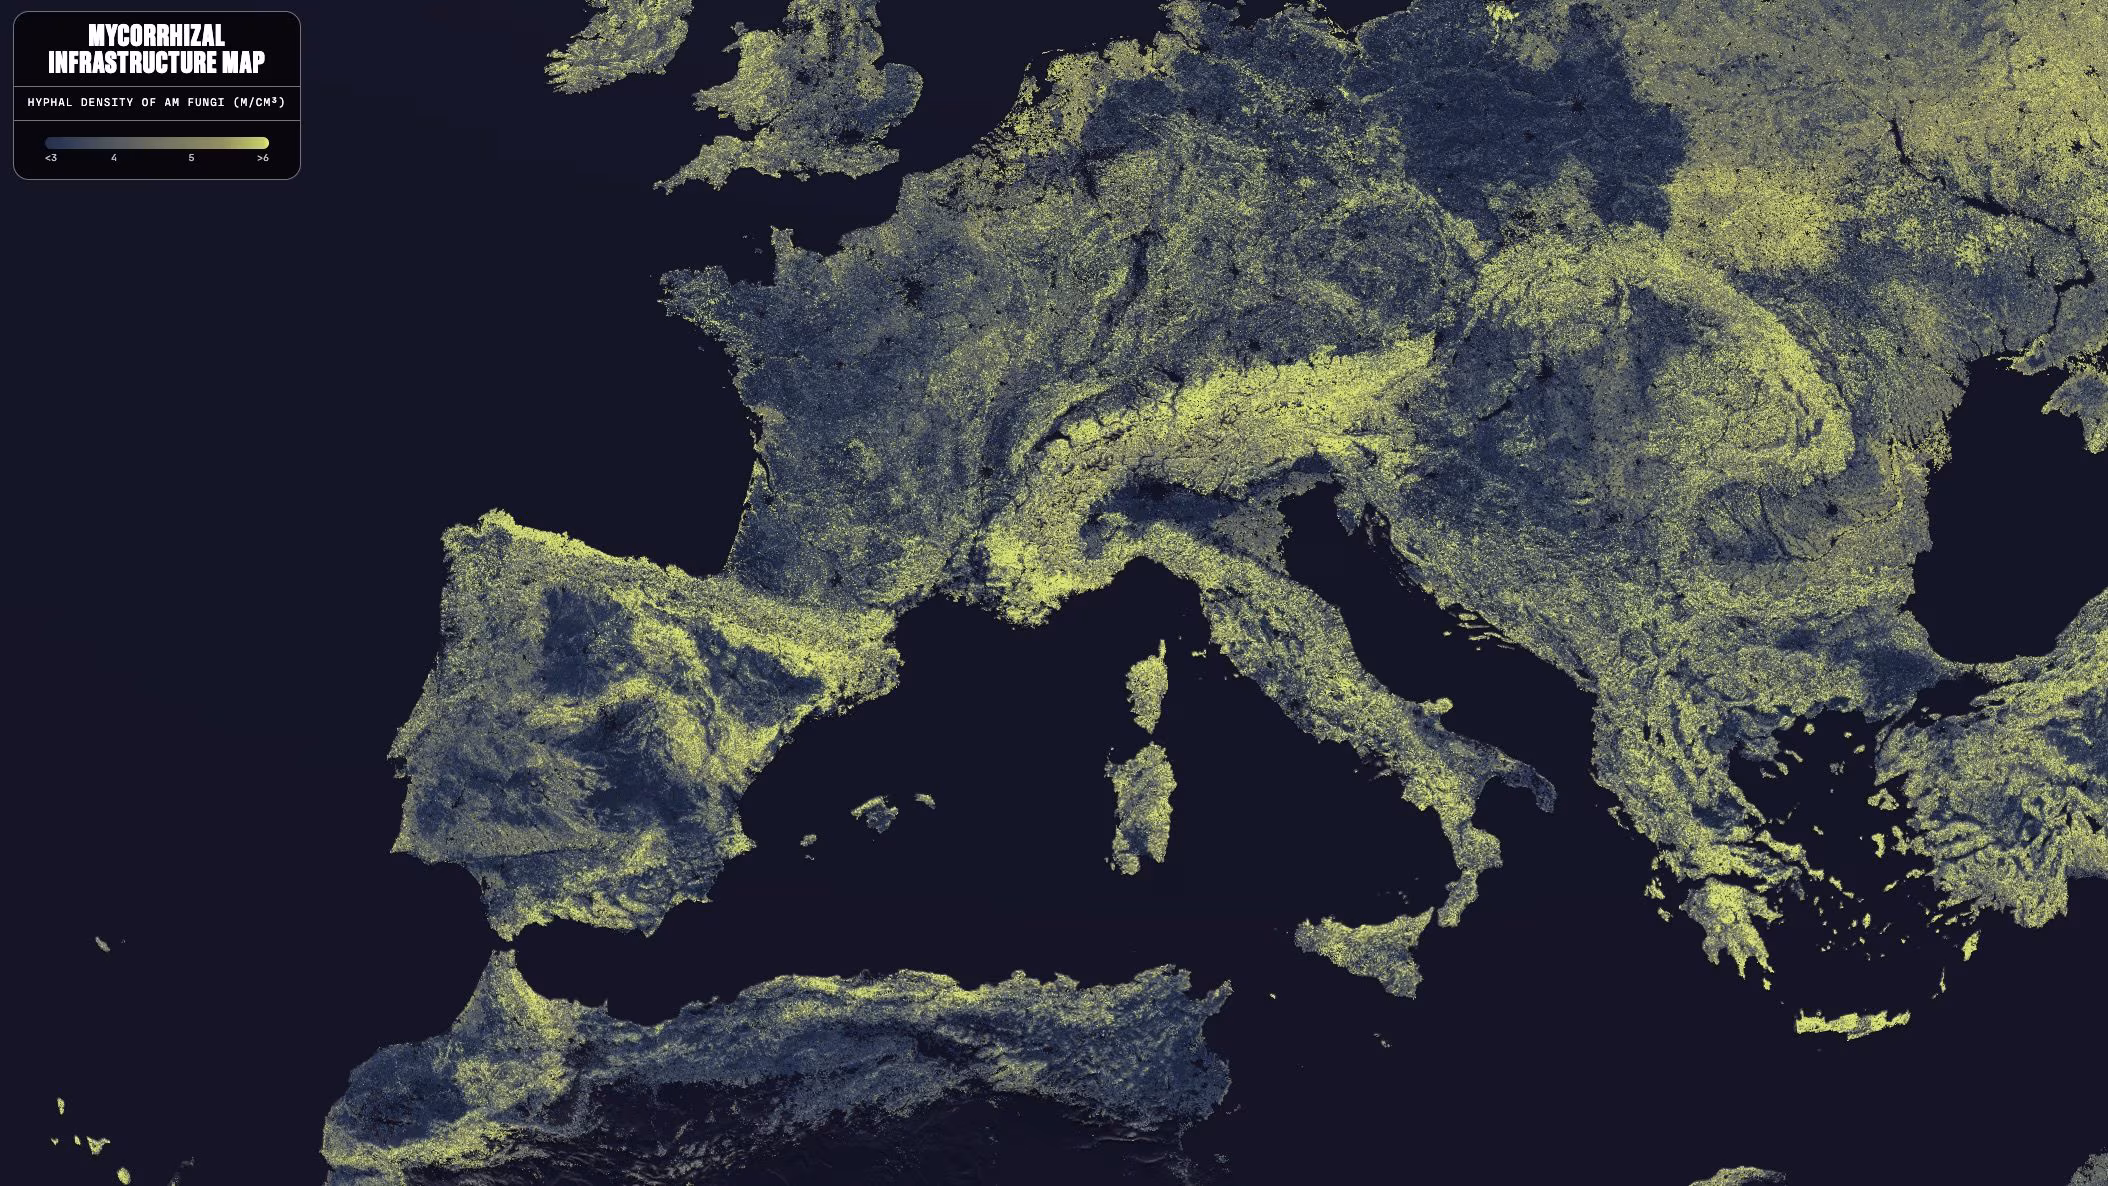
Until now it was impossible to precisely map this colossal underground ecosystem. The feat was achieved by an international team led by researchers Justin Stewart and Corentin Bisot on behalf of SPUN (Society for the Protection of Underground Networks), which he published in the prestigious magazine on 11 June 2026 Science the first global map of this network. By combining artificial intelligence, decades of field surveys and robotic imaging, science has quantified the invisible: the entire fungal infrastructure weighs up to six times the weight of all humanity. The map is available in interactive form at https://www.spun.earth/mapping/a-hidden-infrastructure, with estimates for each square kilometer of land.
Arbuscular mycorrhizal fungi under our feet and the impact on plants
AM fungi are not the mushrooms found in the kitchen or in the undergrowth. They do not produce visible structures above the ground. They live in the first centimeters of soil, like filaments 10 to 50 times thinner than a human hair intertwined with the roots of plants, in a symbiosis that lasts for about 450 million years.
The exchange mechanism is as follows: plants produce organic carbon through photosynthesis and they give part of it to the fungi through the roots. Fungi incorporate it into their structures or release it into the soil in the form of organic compounds: this is how they end up moving around 4 billion tons of CO₂ equivalent in soils each yearequal to 11% of annual global emissions related to human activities.
This carbon exits the atmosphere and remains trapped in the ground long enough to have a measurable effect. Current climate models do not yet include this variable in detail, precisely because until now there was a lack of sufficiently precise data on the geographical distribution of these fungi. In exchange for the carbon given up, the fungi provide the plants phosphorus And waterfall tapping into areas of the soil that the roots alone would not reach. The hyphae extend into the soil well beyond the root zone, increasing the plant’s effective absorptive surface area by up to a hundredfold. About the 70% of terrestrial plant species participates in this partnership, it means that much of the vegetation covering the continents depends, to a varying extent, on this underground network for its nutrition.
The map of the underground fungal network: the techniques and limitations of the study
Measuring the density of fungi in soil on a global scale is a significant methodological problem. There is no satellite technology that detects hyphae, and digging samples everywhere is impractical. The team solved the problem by combining three approaches.
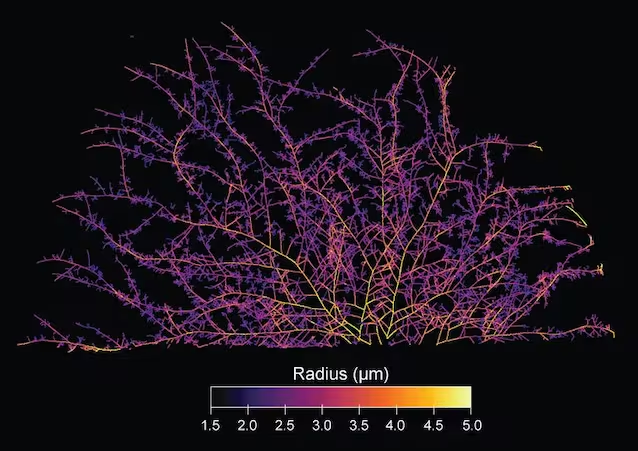
The first was to collect all the existing sampling data: 322 previously published scientific studies, containing measurements from over 16,000 samples of soil taken in nine different biomes (tropical forests, deserts, tundra, prairies, wetlands and so on). The second step was train machine learning models which, by combining those real data with known environmental variables (temperature, humidity, type of vegetation, soil pH), estimated the fungal density for each square kilometer of dry land without direct samples. The third element was the most unusual. Collaborating with the Behavioral Physics group at the AMOLF Institute in Amsterdam, the team used robotic imaging systems to analyze more than 300,000 individual hyphae grown in the laboratory under controlled conditions. This allowed us to build a calibrated biomass model actual filament measurementsinstead of relying on indirect estimates.
The overall result: approx 110 quadrillion kilometers of fungal network in surface soils, for a total mass of approx 300 megatons of carbon – between four and six times the mass of all living humans.
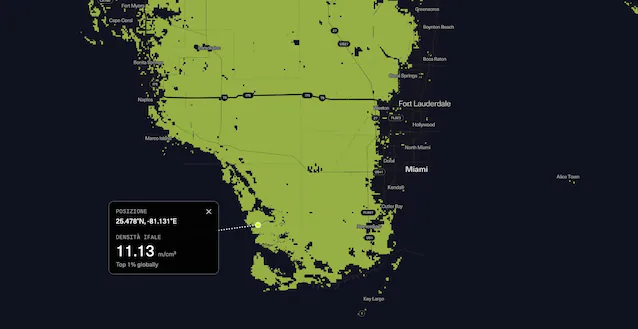
The map revealed a non-uniform distribution. The wild prairies were found to contain approximately 40% of the entire biomass of AM fungi on the planet. Areas with the highest densities include the flooded grasslands of South Sudan, the Florida Everglades, and the Tibetan Plateau.
The problem is that the prairies are being converted into agricultural land at a faster rate than in forests, partly because it is easier than cutting down a forest. In agricultural land, the density of the fungal network is on average about half that in wild ecosystems. Among the reasons we find themechanical plowing which physically breaks the filaments, artificial fertilizers which reduce fungal symbiosis if phosphorus is already available in the soil and many cultivated varieties have been selected to grow well even in the absence of symbiosis.
The authors are explicit about the limitations of the study. Many regions remain subsampled (Central Africa, Central Asia and parts of South America) and the models produce estimates with significant margins of uncertainty. The map describes how many hyphae are alive at a given time, but not how quickly they replace each other. As he commented Adrian Evangelistibotanist from the University of the Côte d’Azur not involved in the study, on LiveScience: “The abundance of living hyphae is important, but for the carbon cycle we also need to know how quickly they grow, die and contribute to stable soil carbon.”
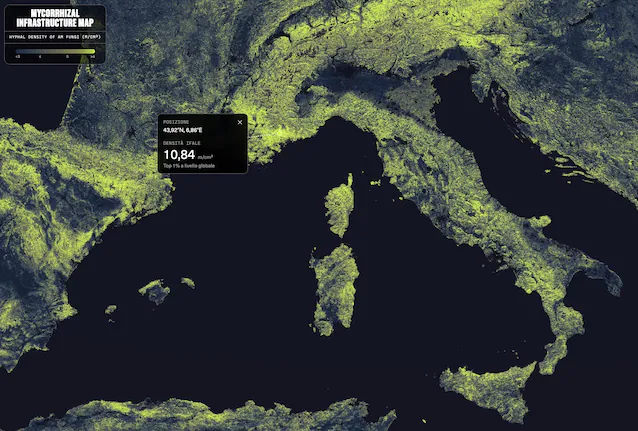
The situation in Italy
Looking at the data relating to Italy, the areas that stand out for the greatest fungal density are the North-West (between Liguria and Piedmont), Sardinia and the entire Apennine chain. On the contrary, the areas of the Po Valley (Lombardy) and Puglia appear to be the poorest areas overall.
The first is one of the most industrialized and intensely cultivated areas of the country, the second is among the most agriculturally exploited regions. This geographical rift is visual proof of what we said before: human pressure and the impact of intensive cultivation physically destroy this immense underground infrastructure.