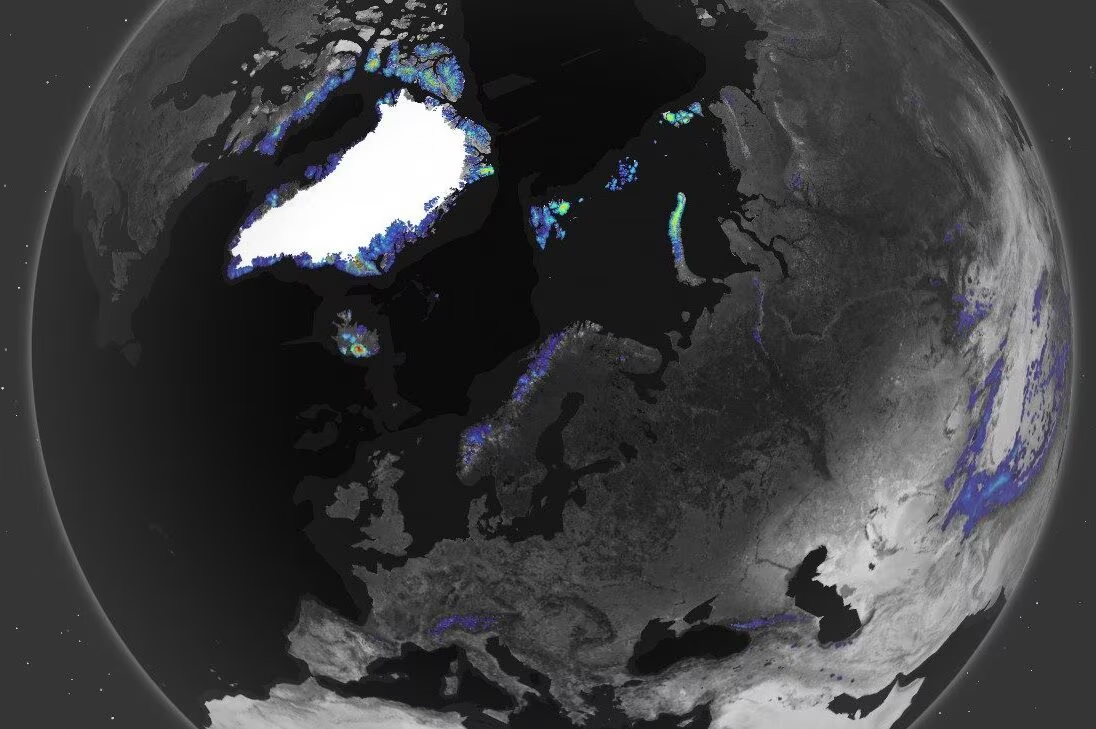
A team of Italian researchers has developed a new Artificial Intelligence model, called IceBoost v.2.0to reconstruct the volume and distribution of glaciers on the planet, excluding the polar ice caps. From the model, trained with over 7 million thickness measurements of iceit turned out that overall the planet’s glaciers (excluding the Greenland and Antarctic ice caps) contain approximately 150,000 km3 of ice. If they melted completely, the average sea level would rise by 32.3 cm. Even if similar estimates had already been made previously, the new model is more faithful to the measurements obtained in the field. Knowing better the available ice volumes contributes to develop more realistic scenarios on the future evolution of glaciers. The study, published in the journal Scientific Datawas coordinated by the Ca’ Foscari University of Venice in collaboration with the Institute of Polar Sciences of the National Research Council (CNR-ISP).
Estimates of glacier volume according to the AI model and the map
As reported by the World Meteorological Organization (WMO), globally there are – in addition to the ice caps of Greenland and Antarctica – approximately 220,000 glaciers. According to the most recent studies, which are based on field surveys and satellite data, these occupy approximately an area 700,000 km² and have a volume of approx 158,000 km³. This value is similar to that obtained with the new model machine learning starting from 7 million data relating to the thickness of the planet’s glaciers.
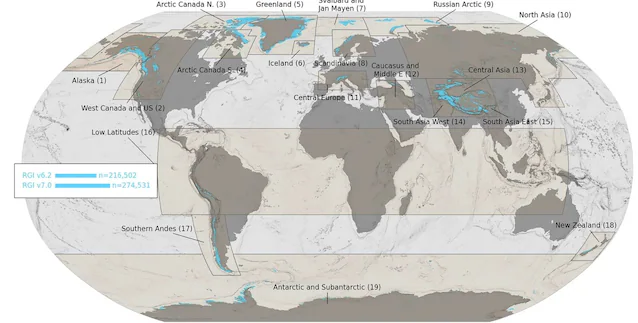
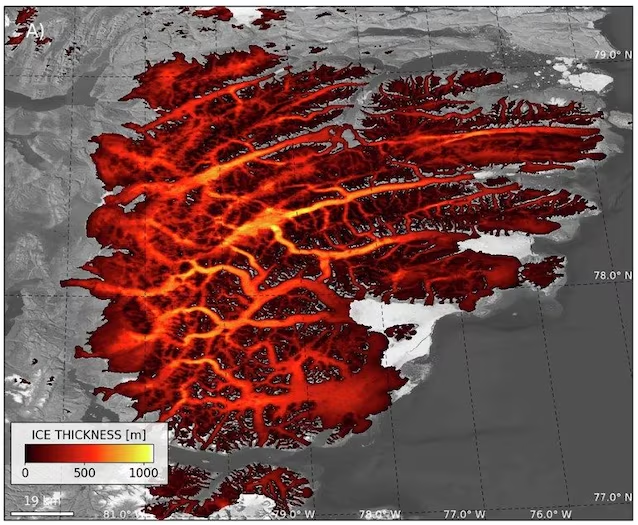
The model combined them with 26 variables physical and geometric of glaciers, such as the slope and curvature of the terrain, the speed of the ice and the temperature. In this way he reconstructed, point by point, the thickness of the ice and therefore the volume of each glacier present in the Randolph Glacier Inventorythe most updated mapping of existing glaciers, excluding the polar ice caps. Compared to previous estimates, those of IceBoost 2.0 are more faithful, up to 40%, to the measurements obtained in the field and more realistic with respect to the distribution of each glacier. For example, IceBoost 2.0 estimates that the Geikie Plateau in eastern Greenland hosts nearly twice as much ice as previous studies. The data can also be consulted by individual citizens thanks to an interactive app.
What is the point of knowing the volume of glaciers
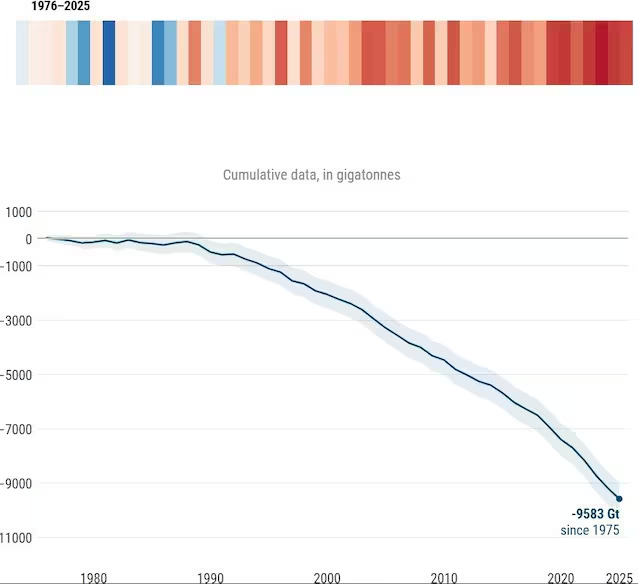
Currently worldwide the glaciers are retreating and they are losing mass due to global warming. It is estimated that between 2000 and 2023, glaciers lost an average of approximately 273 billion tons per year. The overall average variation in ice thickness, considering all glaciers monitored between 1976 and 2025, is approximately 16.5 m. The ice lost globally in 2025 alone corresponds to approximately five times the amount of ice contained in all the glaciers of the European Alps.
Knowing the current state of the glaciers with maximum precision is useful predict how they will evolve by 2100 and to what extent their merger will contribute tosea level rise. Due to its reliability, the new Artificial Intelligence model will be the source of the data on the glaciers on which the next simulations that will be provided to the IPCC (Intergovernmental Panel on Climate Change) will be based. Knowing better the thickness and volume of the ice helps to build more reliable scenarios also on future availability of fresh waterespecially for areas at high risk of desertification. Furthermore, the results obtained with Iceboost 2.0 highlight the areas where the estimates are less reliable, for example those of the Himalayas, the Karakorum and Patagonia. In this way they guide future monitoring campaigns which will have the aim of integrating the data with new measurements.