The CARG project (Geological and Geothematic CARtography of Italy) is the national initiative launched in 1988 and today coordinated by ISPRA to provide our country with one new Geological Map of Italy at 1:50,000 scale. It is a much more detailed and updated cartography than the previous one and which incorporates new surveys. The Italian territory is divided into 634 sheetseach dedicated to a portion of the country: by December 2025 they had been activated 394 And 302 were completed, with the advancement of the sheets very different from region to region. THE’Emilia-Romagnafor example, is now covered for over 97% by the new geological cartography.
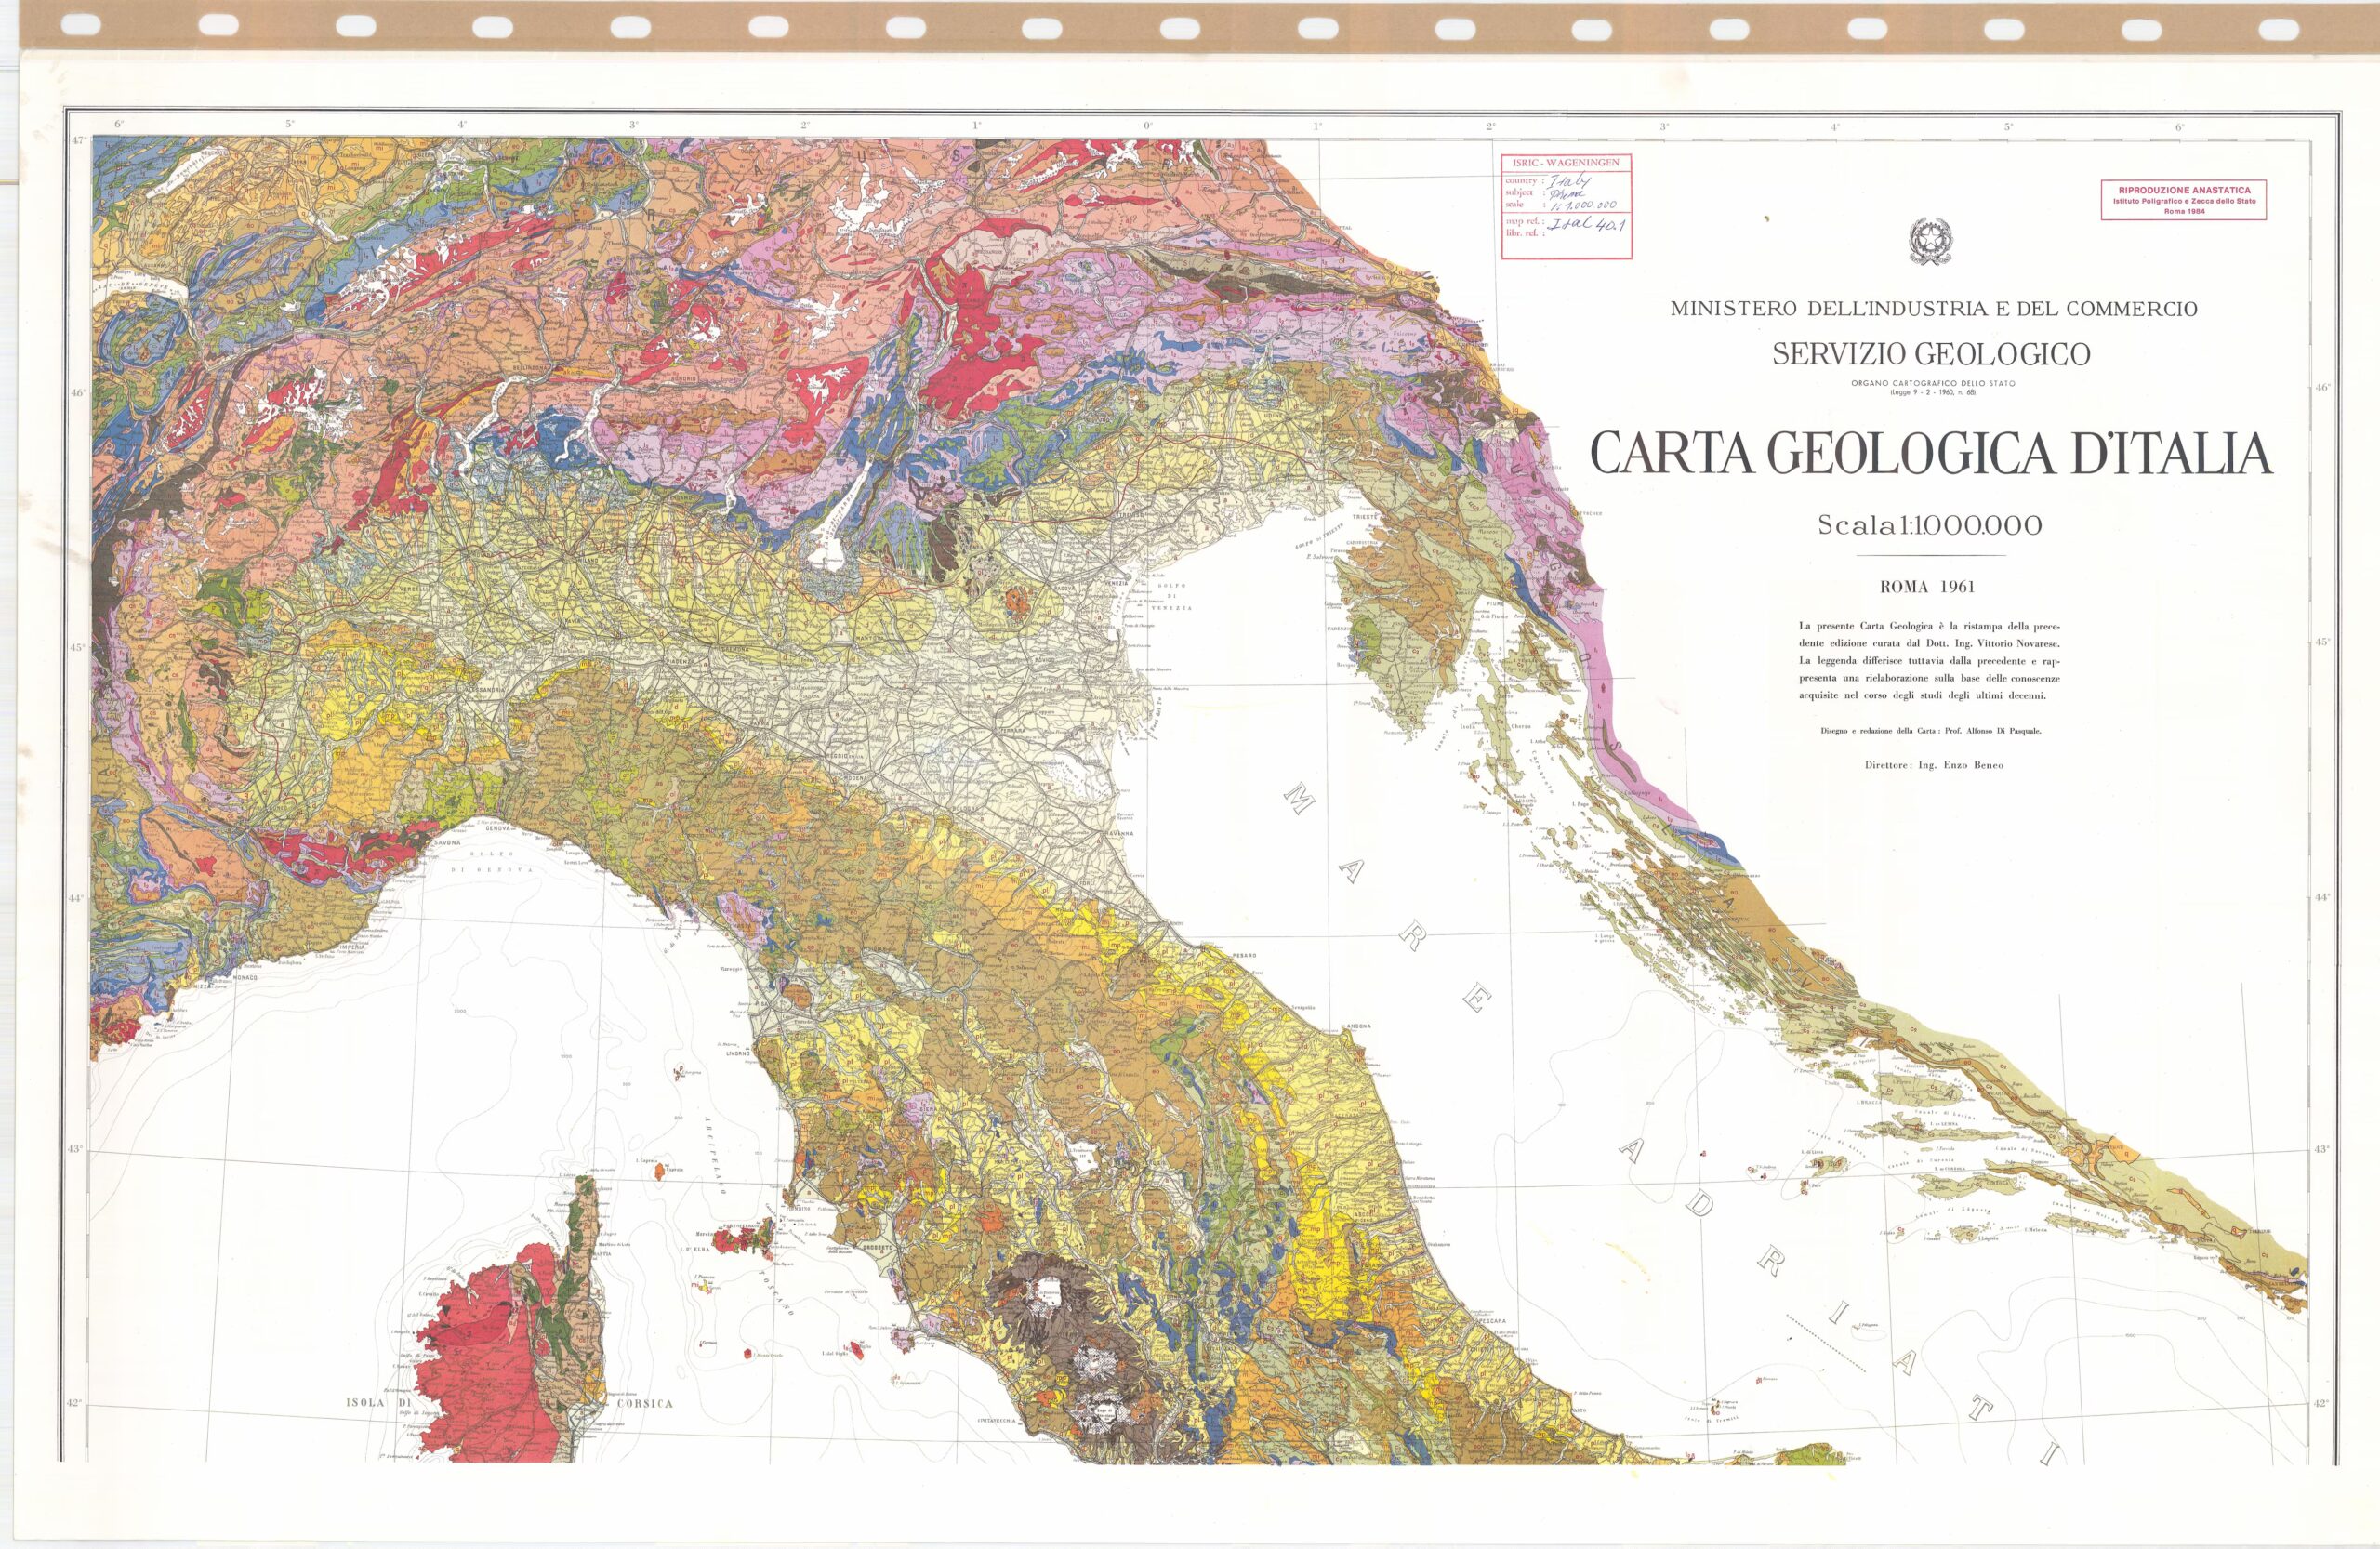
The previous one Geological Map of Italy has a very long history behind it: the first surveys began in 1877 and the coverage of the entire national territory was completed only in 1976exactly fifty years ago. But what, in concrete terms, is a geological map? It’s one map that describes the nature of the territory under our feet: through colours, lines and symbols it indicates where different rocks and deposits emerge, what age they are and how they are distributed and organized in space. If the rocks remained essentially in place, then, why redo the maps? Because in fifty years the way in which we are able to study them has changed profoundly: the detection and analysis toolshave increased available data and we know much better the geological processesfundamental information for understanding and managing the territory.
What changes in the new cards
One of the most immediate differences between the old Geological Map of Italy and the one created with the CARG Project concerns the stairs. The scale indicates how much the real territory has been reduced to be able to be represented on a map. We can imagine observing the same landscape first from far away and then getting closer: the closer we get, the more we are able to distinguish elements that previously were confused with each other.
The previous Geological Map of Italy was created at scale 1:100,000: means that 1 centimeter on paper corresponds to 1 kilometer in reality. The new maps of the CARG Project are instead published at scale 1:50,000so 1 centimeter equals 500 meters. Ground surveys are generally carried out at a scale of 1:10,000 and, in some cases, with even greater detail.
This does not mean that the old maps were wrong: they were built with the tools, data and level of knowledge available at the time. The new cartography instead allows describe the geology more precisely of the territory and to integrate information that was not available in the past.
How to make a geological map
To update a geological map it is not enough to observe satellite images or work in front of a computer: you need to return to the field. Geologists look for the outcropsi.e. the points where rocks are visible on the surface, for example along a rock face, a road or a path. They identify materials, record their location and measure the orientation of geological layers and structures. It is like collecting many pieces of a puzzle distributed across the territory: by putting them together we try to reconstruct not only what we see on the surface, but also how geology continues in depth. For this, data from wells, surveys and drilling are also used.
The so-called can be extracted from the surveys carrotscylindrical samples in which it is possible to observe the materials passed through underground in succession. All this information is then integrated and organized into digital databases according to common criteria. The CARG in fact involves ISPRA together with Regions, autonomous Provinces, universities, CNR and other research bodies: the final map at the 1:50,000 scale is therefore the result of an enormous collective work and one is associated complex database in different information layers, which allows the geological data collected to be consulted and processed.
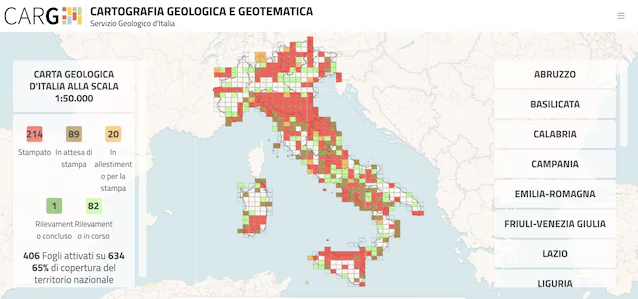
THE products of the CARG Project are therefore not limited to geological maps. They include the official geological and geothematic cartographythe digital databases associated with the sheets and, for some areas, also the reconstruction of the subsurface geology through three-dimensional models. ISPRA has in fact defined specific guidelines for the creation of subsoil maps and 3D geological models connected to the CARG sheets at a scale of 1:50,000. An example comes from Tuscanywhere the CARG Project restarted in 2020. In February 2025, four new sheets were presented – Arezzo, Bibbiena, Castel del Piano and Poggibonsi – while others were under construction, including those of Prato, Empoli, Florence and Roccastrada, in addition to the thematic sheet of geological hazard of Massa Carrara. The construction of a new one is also planned for Florence and Prato three-dimensional model of the subsoil. Furthermore, in the coastal sheets, the project includes the study of submarine geology.
What are the new geological maps for?
A geological map might seem like a tool intended primarily for geologists. In reality it represents one of the knowledge bases from which to start to understand how use, plan and protect an area. Let’s think, for example, about the construction of a road, a tunnel or other infrastructure. Knowing the materials that the work would pass through is one of the first pieces of information needed to plan more in-depth studies and investigations. The same goes for a slope: knowing the type of rock, the presence of fractures and the arrangement of the layers helps to set up studies on its stability.
Geological information is also important for understanding the behavior ofunderground water. Water and rocks interact continuously and different materials can favor their passage, slow it down or hinder it. Know the geological structure of the subsoil it is therefore essential to study the aquifers and plan the activities necessary for their protection. The CARG Project database also constitutes a cognitive tool that can be used in territorial planning and in studies related to prevention and to mitigation of hydrogeological risk.
Naturally, geological maps do not replace the specific studies necessary to construct a work or evaluate a specific risk. However, they provide the knowledge base to start from. And this is where we understand why it makes sense to update a map even if the rocks have been there for millions of years: what we have under our feet has not necessarily changed. The precision with which we are able to read and represent it has changed.