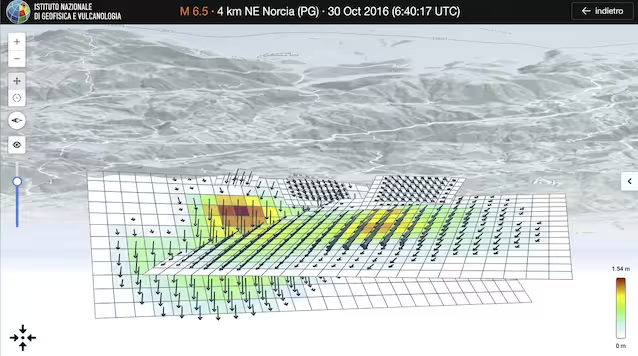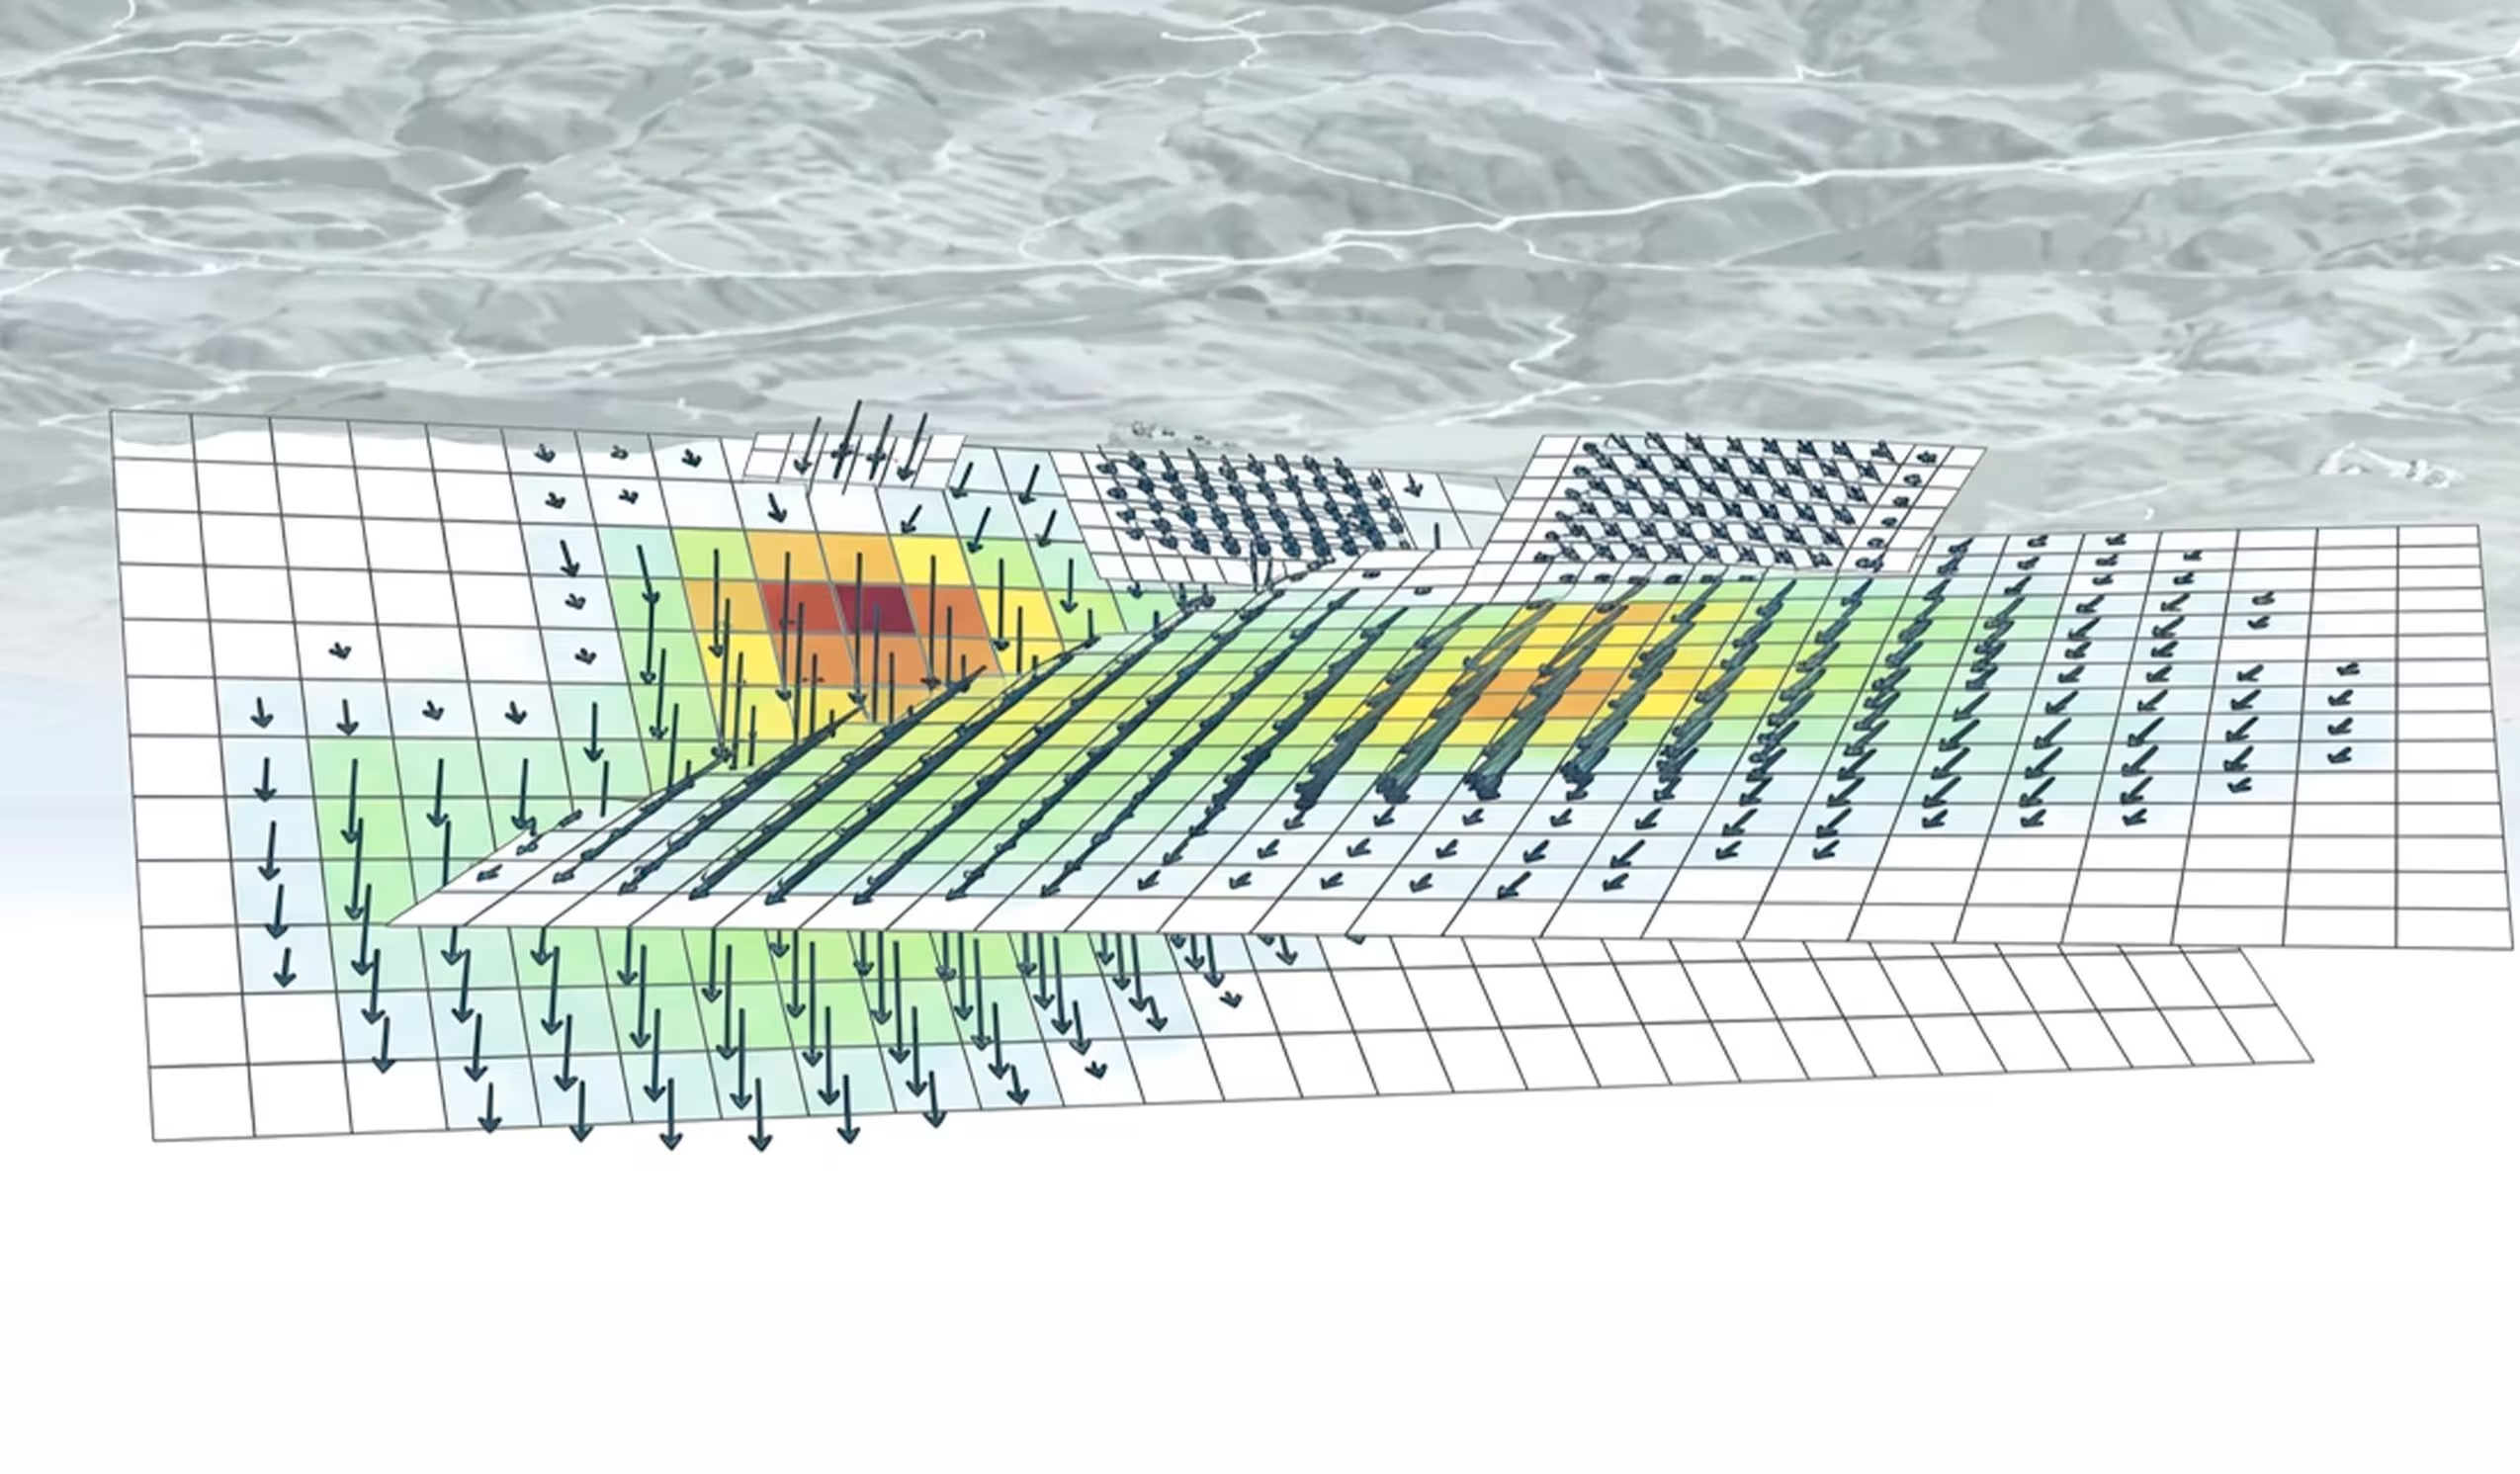
INGV has created new 3D models of the main faults responsible for the 2016-2017 seismic sequence in Central Italy, in the Sorgente Estesa portal.
We all remember the seismic sequence of Central Italy of 2016-2017the one sadly known for its earthquakes Amateur, Visso And Norcia. On the occasion of the tenth anniversary, INGV recalculated the rupture models along the faults of the three main events, showing how the surfaces involved exceed 500 km²with flows on them reaching almost 2 metres. The data can be freely consulted on the INGV portal of Sorgente Estesa, but how were they obtained? The starting point is a technology called InSAR.
How to measure a fault that is km underground: InSAR
How do you measure a fault that is kilometers underground? One of the most effective methods we have is to observe the surface: when a fault ruptures, in fact, in addition to the shaking it leaves a permanent deformation of the ground, in an area approximately 3-4 times the size of the fault itself. Precisely this deformation can be “photographed” with thedifferential interferometry SAR (InSAR). This technology involves comparing satellite radar images before and after the earthquake. The result is maps with colored fringes, where each fringe is worth approx 2.8 cm of displacement.
The results of the analysis
Once these images have been obtained, the inversion of the data comes into play, that is, we start from the visible effects (the deformation) to trace the causes (the fault). On the occasion of its tenth anniversary, INGV did just this: ha re-analyzed the InSAR images using improved algorithms. Here are the results.
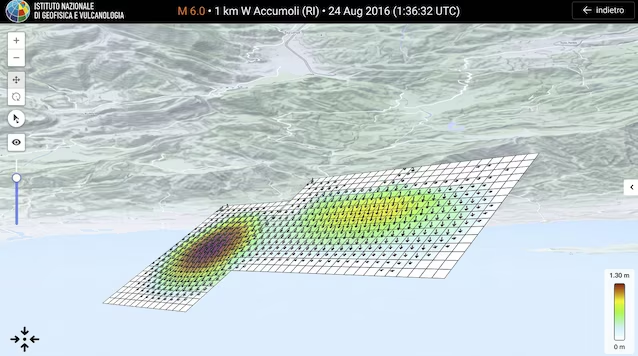
MW 6.0 earthquake of 24 August (Accumoli-Amatrice). This earthquake occurred along a fault with an Apennine orientation (north-west/south-east) and dipping towards the south-west. InSAR analyzes allowed the identification of two separate creep peaks, of 1.4 and 1.0 meterslocated on two adjacent fault segments, for a total area of approximately 144 km².
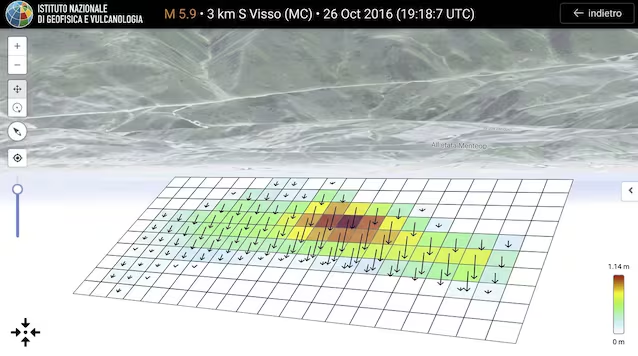
Mw 5.9 earthquake on 26 October (Visso). The October 26 another large shock occurred near Visso, along a fault located north of the one on 24 August, again with orientation Apennine And dipping towards the south-west. In this case the sliding area is approximately equal to 84 km²with a maximum value of dislocation of 1.2 metres.
Mw 6.5 earthquake on 30 October (Norcia). This was the event strongest in the sequenceas well as the one whose shape of the InSAR fringes revealed greater complexity of the source. In fact, it was seen that there were two main rupture planes: one with an Apennine direction and dipping towards the south-west like the previous ones, and one auxiliary low angle diving direction north–west. The same InSAR maps also showed the presence of three minor segments, thus defining an entire system of faults. The area affected by the sliding measures approximately 200 km² on the main floor e 126 km² on the auxiliary one, with maximum slip values of 1.9 and 1.5 meters.