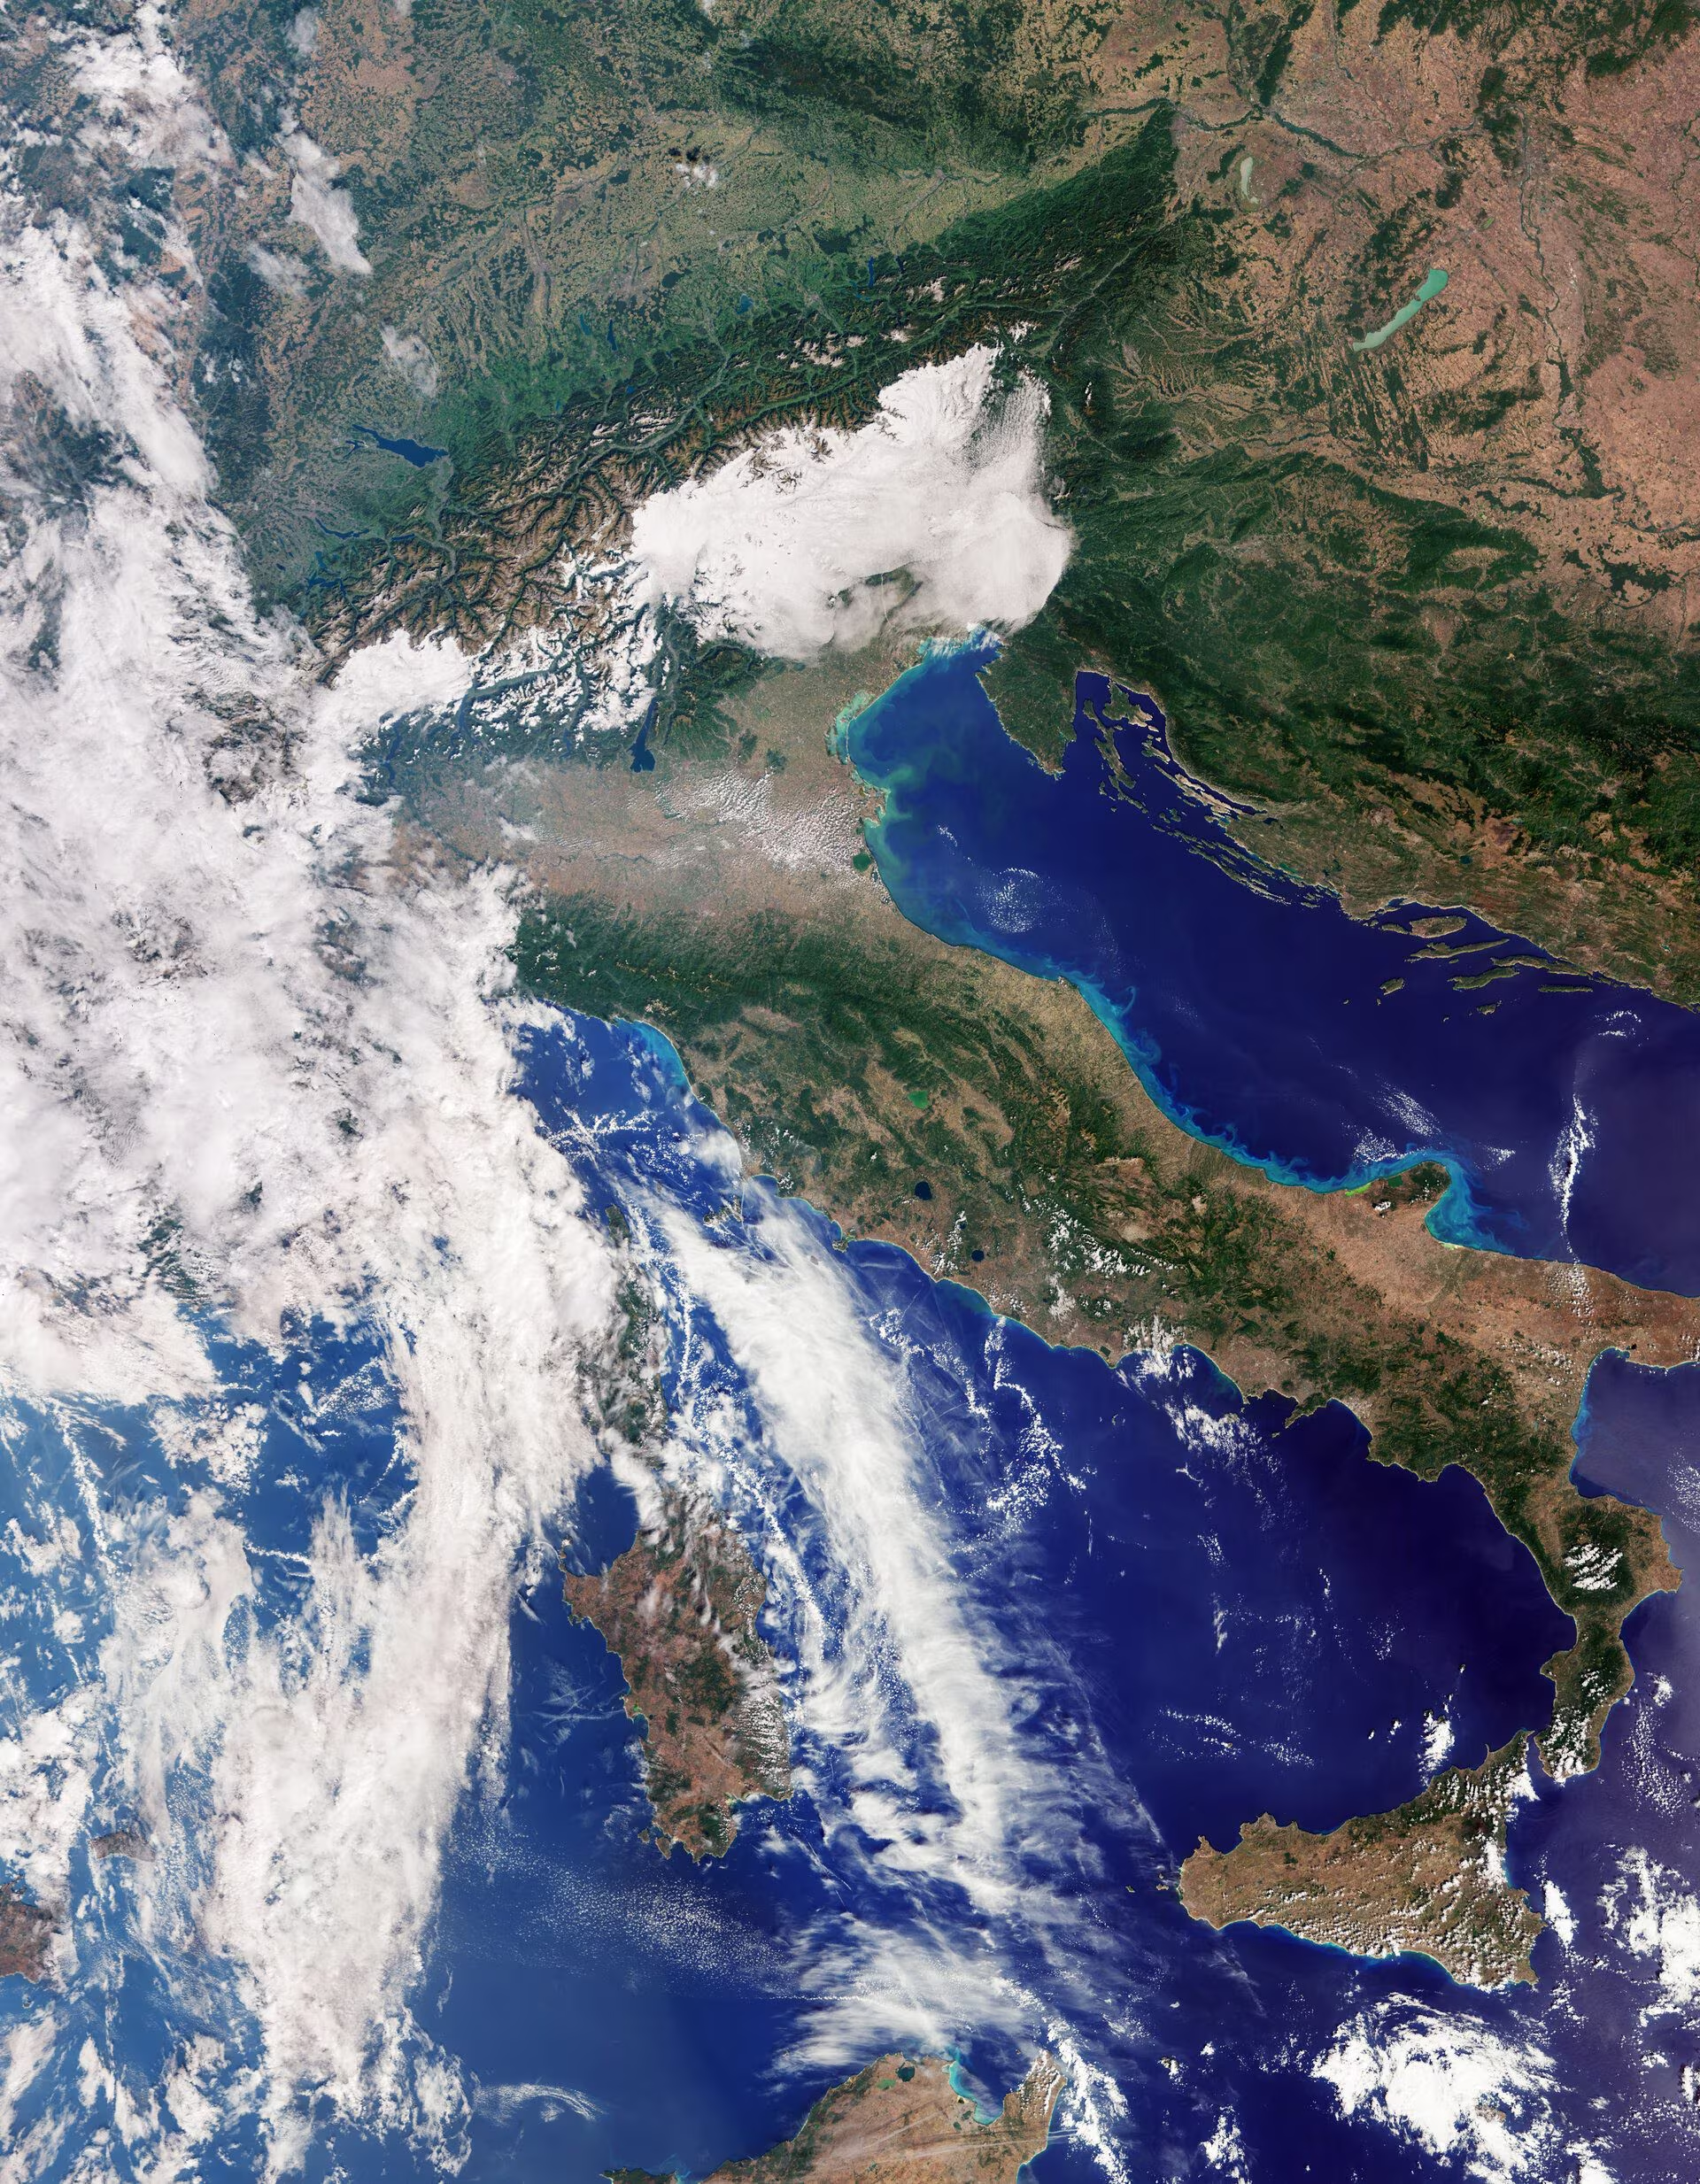
The European satellite Sentinel-3C he sent his first images of the Earthpublished byEuropean Space Agency (ESA), last October 8: Italy is also among the areas filmed.
But it’s not just about beautiful images of the planet, it’s about a mission designed to measure color and temperature of surfaces, the sea level and the characteristics of ice. In the image of Italy, acquired on 30 September, we can recognize the Alps snow-covered, the Po Valley and much of the peninsula. Along the Adriatic coast the sea has lighter shades: according to the ESA, they are probably linked to sediment transported by rivers and redistributed along the coast.
What is Sentinel-3C and how it observes the Earth
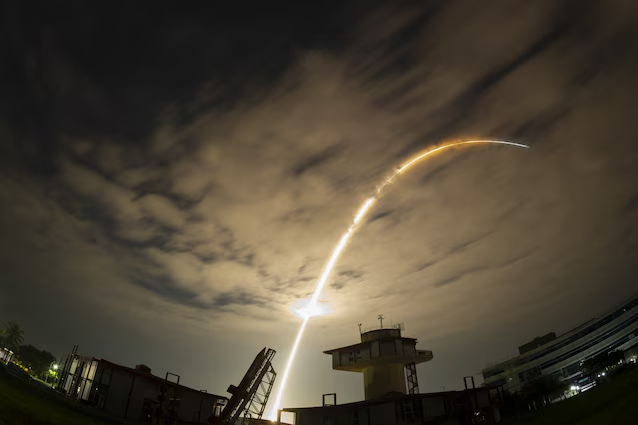
Sentinel-3C is part of Copernicusthe European program of Earth observationand the collection of environmental data from the Sentinel-3 mission continues. It is the third satellite of the series, after Sentinel-3A And Sentinel-3Blaunched respectively in 2016 and in 2018. It was carried into orbit by a Vega-C rocketwhich departed from the European spaceport in French Guiana with also on board FLEXan ESA satellite dedicated to studying the photosynthetic activity of vegetation.
Sentinel-3C has been observing Earth for approximately 815 kilometers high and combine four instruments main for studying oceans, emerged lands, ice and atmosphere. This feature makes Sentinel-3 the most complex mission among all Sentinel missions.
It is he who carries out the filming OLCIwhich records the light in 21 wavelength rangescalled spectral bands, from visible to near infrared. It is not only used to obtain color images: its data contribute, for example, to estimating the concentration of chlorophyll and suspended materials in water, useful for studying marine ecosystems.
The radiometer SLSTRinstead, allows us to obtain the sea and land surface temperature from infrared observations. It also has two channels dedicated to tracking fires and to the measurement of their radiative power, that is, how much energy they radiate every second: useful data both for emergency management and for the study of the effects of fires on the environment, important for the response to today’s climate emergencies.
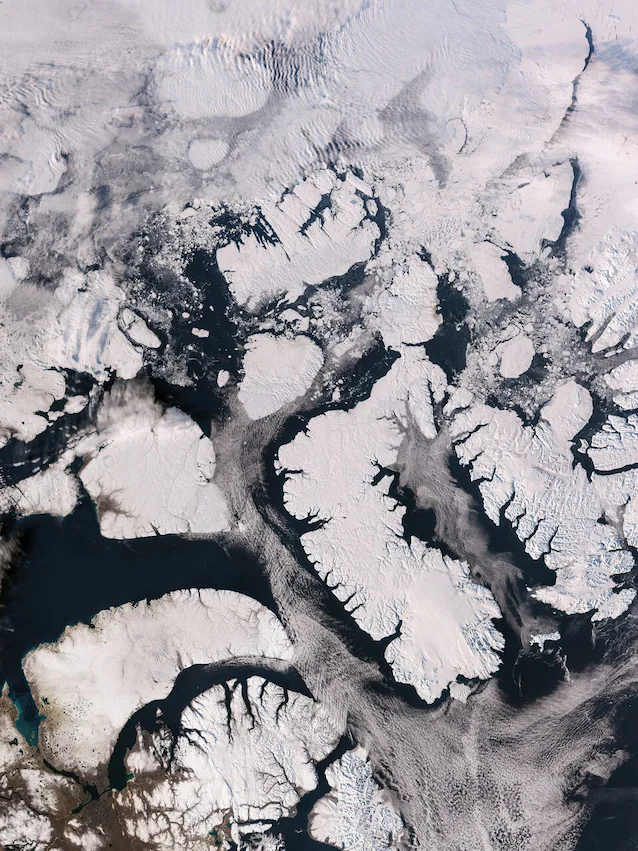
THE’SRAL radar altimeter it sends pulses towards the surface and measures how long it takes them to return. By knowing the position of the satellite, it is possible to calculate the height of the observed surface. The microwave radiometer MWR allows you to correct the effects of water present in the atmosphere on the radar signal. In fact, among the first results of Sentinel-3C there are also measurements of the height of the Greenland ice sheetcollected between September 30th and October 4th. They are not photographs of the ice, but altimetric data: repeated over time, they allow changes in altitude to be followed.
In any case, iSentinel are organized in six main families of missionsfrom Sentinel-1 to Sentinel-6. But the names can be misleading: Sentinel-3 is not the most powerful version of Sentinel-2, just as Sentinel-6 does not replace all previous versions. Each family observes the Earth in its own way. Sentinel-3, for example, combines color observationstemperature and height of the surfaces.
Satellite images, from Italy to the Arctic: how to see them with Copernicus Browser
THE Copernicus data they are not reserved for researchers, but they are free and accessible to all. To explore them from your computer you can use the Copernicus Browser portal, an online platform which, with a free account, allows you to search, view and download the available images.
In the case of Sentinel-3, we can select data from the OLCI tool, the same one that created the image of Italy shown previously. Each pixel represents an area of approx 90,000 square meters (300 meters per side). Although the resolution is lower than that of other Sentinel satellites, this allows for rapid observation very large portions of the planetwith wide bands around the 1270 kilometers. In practice, Sentinel-3 sees fewer details, but manages to monitor much larger portions of the Earth and come back very often. With the Sentinel-3 constellation, the same area can be observed again in about one or two days.